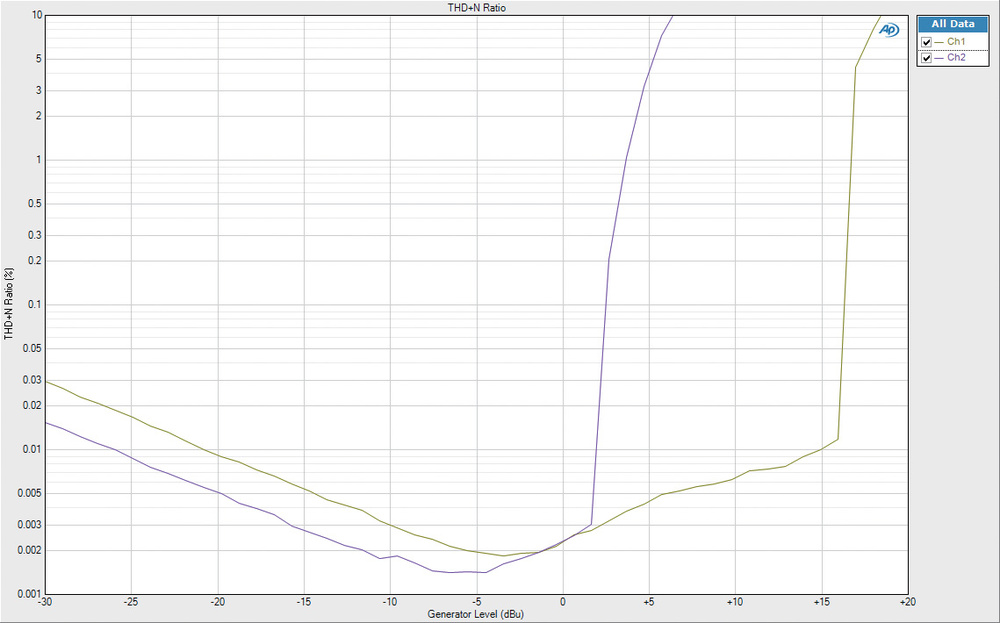
Orchid Electronics DI Boxes | Media
Audio Precision Analyser Test Plots
Reviews : Accessory
Hugh Robjohns
The following test plots were taken during the course of Hugh’s review of the Orchid DI boxes.

A comparison of the frequency response and gain between the Orchid Micro DI (green trace) and Radial J48 (purple trace), with a -15dBu input.

The averaged noise spectrum of the Orchid Micro DI (green) and Radial J48 (purple). The Orchid’s noise floor appears lower because it has a different gain structure, while the Radial’s plot reveals more second and third harmonic distortion (due to its output transformer) and slightly more susceptibility to mains hum on the phantom supply.


These two plots reveal the slightly lower levels of harmonic distortion in the Orchid DI box thanks to its transformerless design.

This graph illustrates how the THD+N figure varies with input level. The Orchid Micro DI (green) exhibits a marginally higher figure (0.002 versus 0.0015%) than the Radial J48, but also has considerably greater headroom (+16dBu versus +3dBu).

This graph shows the same comparison, but with the 15dB pad activated on the Radial J48. As a result the two units now have similar headroom margins, but the Radial’s THD+N figure is slightly degraded (0.003 versus 0.002%).
0