Building on the concepts explored in previous parts of this series, it’s time to weigh up some of the pros and cons of coincident and spaced arrays.
Previously in this series I focused on a range of coincident microphone techniques, and you’ll recall that with all such techniques, perceived position on playback depends entirely on level difference in the two channels. This time, we turn our attention to spaced stereo arrays, which introduce time‑of‑arrival differences between the two microphones. These give an entirely different sense of stereo imaging — less precise and more diffuse — but it’s often also subjectively appealing, and there can be benefits as I’ll explain below.
Precision Position
First, let’s pick up on that point about ‘precision’. With coincident arrays, equal volumes in each channel create a ‘phantom’ central image source in the speakers, and introducing a level offset between the channels moves the sound source towards the louder channel’s speaker. It’s not equal for all frequencies, though.
For mid and high frequencies, which tend to be portrayed wider than intended when auditioned over stereo loudspeakers, an offset of around 4dB places the sound about a quarter of the way out towards one speaker. 8dB is half‑way, 12dB is three‑quarters, and 16dB puts the source firmly in one speaker (see Diagram 1).
 and timing (right).") Diagram 1: Perceived pan position caused by differences in inter‑aural level (left) and timing (right).
Diagram 1: Perceived pan position caused by differences in inter‑aural level (left) and timing (right).
These are only rough guide numbers — different listeners and different monitoring environments might need smaller or larger offsets to achieve the same perceived image positioning. But slightly larger offsets are typically needed to match positions for the lower frequencies. It’s why EMI developed the Stereosonic Shuffling correction process I described back in Part 3. (There are other issues that affect the precision of stereo imaging over speakers, and various remedies, but I’ll save that for another article!)
Coincident mic arrays aren’t the only means of creating the impression of different spatial positions, though. As Dr Fletcher discovered with his ‘curtain of sound’ experiments, reproducing small inter‑channel timing differences also works — though arguably with less well‑defined image locations.
Remember, the ear/brain uses inter‑aural timing differences to help locate sound sources around us, and for a source located 90 degrees to one side, the difference in arrival times for a sound at each ear is about 0.67 milliseconds. Yet, if we introduce that kind of time delay between channels replayed over stereo loudspeakers, the sound source will be perceived as being barely half‑way towards the earlier loudspeaker — this is because sound is coming from both loudspeakers, each introducing their own time delays for sound arriving at each ear. Essentially, it’s an unnatural and confusing situation, as far as the ears/brain are concerned. We can still create the impression of a sound source being fully in one loudspeaker, but the time offset between channels actually needs to be around 1.5ms (again, see Diagram 1).
So, if we’re to utilise inter‑channel timing differences to create the illusion of sound source positions between stereo loudspeakers, how can we arrange a pair of microphones to capture only suitable inter‑channel timing differences that relate proportionally to the real sound source positions? It’s probably fairly obvious that to capture time‑of‑arrival differences between the two channels, we’ll need to space the mics apart by a small distance: sound from a central source will arrive at both mics at the same time (giving a central phantom sound image), but sound from a source located to the left will reach the left microphone slightly before the right one, resulting in a small time difference between the channels.
With the two microphones spaced apart, the inverse‑square law of sound propagation — sound energy decreases with distance from the source — means that the more distant mic will also always receive a slightly lower sound level than the closer mic, so a small level difference between channels will be captured too. However, if the mics are reasonably far away from the sources, but not too far apart from each other, any channel level difference will be insignificant in terms of sound image location information. Moreover, if we use omnidirectional microphones, the relative angle of sound incidence won’t affect the sound level either...
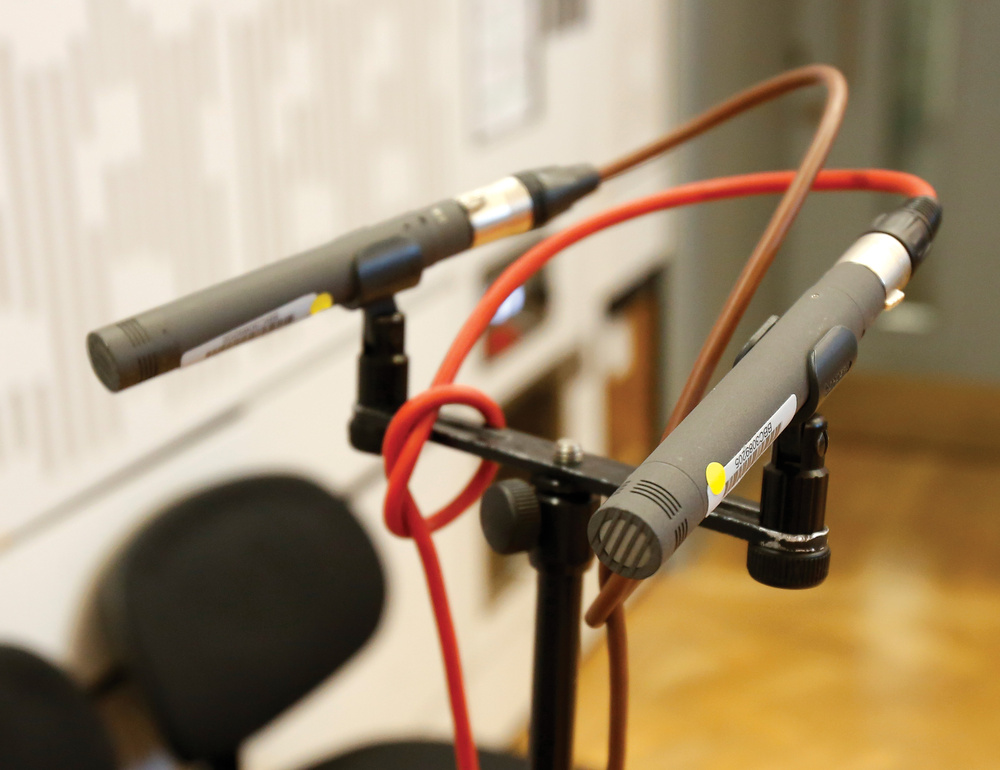
Spaced Omnis
So, we have a pair of omnidirectional microphones spaced apart specifically to capture time‑of‑arrival differences — a technique generally referred to as ‘spaced omnis’ or A‑B stereo (in contrast to the coincident or X‑Y stereo technique). As an aside, it’s worth noting that Alan Blumlein also experimented with spaced omnidirectional mics in the 1930s, coming up with an arrangement most know today as the Jecklin disc; I’ll discuss that concept another time.
If two omnidirectional mics are mounted coincidentally, there can be no level or timing differences between the signals they capture. Whatever the sound source’s position relative to the mics, identical signals in both channels will create a phantom central image over the stereo loudspeakers. If the mics are gradually moved apart, though, sound from a source located to one side of centre‑stage will reach the closer mic slightly before the more distant mic, resulting in a small inter‑channel timing difference.
So, what kind of mic spacing do we need to generate an inter‑channel timing difference sufficient to place the sound fully wide in one loudspeaker? Consider a sound source, located at 90 degrees to the microphones (ie. fully left), that we want to perceive fully in the left‑hand speaker. As suggested above, the sound waves must arrive at the left‑hand microphone 1.5ms before passing across the right‑hand microphone — sound travels around 34cm per millisecond, so achieving that delay requires the mics to be spaced 51cm (34 x 1.5) apart, as in Diagram 2.
 Diagram 2: If the distance between mics is less than 51ms, no sound will appear to be ‘fully panned’.
Put the mic capsules closer together than 51cm, then, and it will always be impossible to generate a timing difference between channels as large as 1.5ms, whatever the source position — the image width on loudspeakers will always be narrowed, and collapses to a phantom centre as the capsules approach one another. Conversely, if the capsules are moved further apart, a sound source would need to move a smaller distance from the centre line to generate the 1.5ms difference.
This gives us a very practical way of controlling the Stereo Recording Angle (SRA) from spaced‑omni microphones: increasing the capsule spacing reduces the SRA. We’ve seen that a capsule spacing of 51cm gives an SRA of 180 degrees, while increasing the spacing to 73cm reduces the SRA to about 90 degrees. Inevitably, if the capsules are moved too far apart, the channel timing differences generated by off‑centre sound sources can exceed 1.5ms. That breaks the stereo system — instead of a continuous spread of sound between the two loudspeakers, we perceive ‘puddles’ of sound localised at each speaker, with a gaping ‘hole’ in the middle of the sound stage. This ‘hole‑in‑the‑middle’ effect was quite common in early commercial stereo recordings, partly by design, as record labels tried to emphasise the benefits of two‑channel recordings: “Completely different sounds from your two loudspeakers — so much better than mono!” Some labels cured this hole‑in‑the‑middle problem by adding a third, central, omni mic... Again, I’ll explore that another time.
SRA Rules
In Part 3, I defined a Rule 1, for fine‑tuning the SRA of a coincident array by adjusting the mutual angle. We can now add a second rule for the capsule spacing in spaced arrays:
- Rule 1: Reducing the Mutual Angle (MA) increases the Stereo Recording Angle (SRA).
- Rule 2: Reducing the Capsule Spacing (CS) increases the SRA.
In both cases, reducing the separation between the microphone capsules increases the SRA, and increasing the separation decreases the SRA. This makes sense if you think about it because if the capsules are closer or pointing in similar directions, a sound source has to move further out to create a sufficient level or time difference between the two channels.
With coincident X‑Y arrays, the useful range of mutual angles between capsules is typically from about 75 to 120 degrees, with 90 degrees as the nominal sweet spot, although the actual SRA also depends heavily on the chosen polar pattern of the mics. For an A‑B or spaced‑omni array, the useful capsule spacing ranges from 51cm to about 1.5 metres, corresponding to SRAs of 180 to about 40 degrees, respectively. The sweet spot is usually somewhere around 66cm (SRA = 100 degrees) in my experience, but the required SRA (and thus spacing) depends mainly on how far back from the source the mic array must be to achieve the appropriate perspective or acoustic ambience. Last month I mentioned the Neumann and Sengpielaudio tools as fabulous aids for visualising and calculating the SRAs for most coincident microphone arrays, and both tools can demonstrate and calculate the SRAs for spaced‑omni microphones too. And if you want to compare the effect of the different approaches, see the ‘Subjective Differences: Audio Examples’ box.
Speaker & Headphone Listening
Of course, although stereo recording was originally conceived and developed for reproduction over loudspeakers, that’s not the way a large number of people listen to their music today. Headphones (and earbuds) have become very popular, but they present sound to the ears in a very different way. When listening to loudspeakers both ears hear both loudspeakers and that inherently results in both inter‑aural level differences (ILDs) and inter‑aural timing differences (ITDs) at the ears — these being critical in our perception of spatial positioning. Listening through headphones inherently removes the ‘crosstalk’ between source loudspeakers and ears, since each ear can only hear the channel feeding that earpiece. Consequently, when wearing headphones only the ILD and ITD information embedded within the two‑channel stereo signal is available to the brain to try and work out source locations.
Spaced‑omni recordings generally sound much more natural than coincident ones when auditioned on headphones.
The Intensity Stereo format, using coincident mics, explicitly excludes all timing differences between the channels, so there is no ITD information for the brain to decode. This is a very unnatural situation, impossible in real life, and the result is that most people’s brains deduce a solution where the sound sources exist inside the head, spread along a line between the ears, rather than outside it. In contrast, the spaced microphone technique does capture time‑of‑arrival information between the channels — albeit with very large ITDs — and that is passed directly to the listeners ears when wearing headphones or earbuds. Consequently, spaced‑omni recordings generally sound much more natural than coincident ones when auditioned on headphones, often with the impression of sound sources outside the head, and the imaging tends to be more precise and less vague than if auditioned over loudspeakers. Again, you can try this for yourself using the same tracks linked to in the box — but this time listen over headphones and compare the results with the stereo imaging over loudspeakers.
Next Month
In the next issue, I’ll be looking at microphone techniques which combine both directional microphones and spaced capsules — hybrid arrangements that seek to combine the best of both worlds for spacious‑sounding recordings with precise stereo imaging.
Stereo Metering Tools
Although the final arbiter of good stereo imaging must be the ears, there are several metering tools which I find very helpful, both for confirming what I’m hearing by providing a reliable qualitative reference point (especially when working on location or with unfamiliar monitoring setups), and for highlighting any imaging issues my ears may have missed! As a BBC‑trained audio engineer I was taught to appreciate the stereo information presented so cleverly on the uniquely British ‘twin‑twin PPMs’. If you’re interested in learning more about the BBC twin‑twin PPM system, check out the other box in this article. While hardware twin‑twin PPM units become available on the various online marketplaces from time to time, I can also recommend an excellent plug‑in emulation called PPMulator XL from zplane (https://products.zplane.de/products/ppmulator) but be quick — zplane are discontinuing it from January 2026!
Phase Correlation Meter: Outside of the BBC, the recording industry historically relied on the humble Phase Correlation Meter, typically used alongside left and right VU meters. The classic phase correlation meter usually has the right half of the scale coloured green and the left half red (sometimes with a yellow region across the centre). More modern systems are typically configured as a bar‑graph meter, but either way the display shows the instantaneous phase difference between the left and right channels. The scale ranges from ‑1 (180 degrees) at the left or bottom of the red region, through 0 (90 degrees) at the centre, up to +1 (0 degrees) at the right or top of the green section (see Diagram 4). So, when the two channels are identical (eg. a centre‑panned signal) the display sits solidly at +1 (0 degrees), and if the two channels have opposite polarities (ie. fully out of phase) it will indicate ‑1 (180 degrees). A full‑width stereo signal typically registers around 0 (90 degrees), and so the aim for a good, wide stereo mix is to get the meter approaching as close to zero as possible, ideally from the positive (green) side!
 Diagram 4: A phase correlation meter.
With most commercial stereo material the meter typically sits within the green, positive section most of the time, and usually fairly close to the zero, although if the music has strong central components (vocals, bass, kick/snare) the meter will move closer to the +1 end. If it’s hovering around the zero but dips briefly into the red or negative section there’s usually nothing to worry about — it’s just showing instantaneous phase excursions over 90 degrees.
However, if the meter remains consistently below zero, in the red area, that indicates a potential problem with mono compatibility due to strong out‑of‑phase components in the mix (such as a stereo chorus effect or overly wide reverb, perhaps). So, although very simple, the phase correlation meter provides a very helpful guide to mono compatibility and the overall stereo width.
Stereo Vectorscope (Goniometer): A much more informative alternative is the Stereo Vectorscope or Goniometer. This was originally implemented in the 1960s and ’70s using modified oscilloscopes, but digital versions made by companies like RTW and DK Technologies were commonly embedded in large mixing consoles from the late ’80s. Today plug‑in equivalents are plentiful, although hardware vectorscopes are still available. Essentially, the left channel controls one axis and the right channel the other, so that the instantaneous signals in the two channels guide the light ‘spot’ over the screen area, tracing a wandering line (which fades over time) to create a ‘ball of string’ effect.
 Diagram 5: A digital goniometer plug‑in.Most vectorscope implementations display left‑channel signals on a line angled 45 degrees left, and right‑channel signals angled 45 degrees right. This arrangement means that the mono sum is represented by the vertical axis, and the stereo difference signal by the horizontal axis. Diagram 5 is a plug‑in version included in Cockos Reaper.
In use, a centre‑panned signal is represented by a thin vertical line, the height of which reflects the relative signal amplitude (most systems have an auto‑gain ranging system so that low‑level signals remain visible). As the width of a stereo signal increases a ‘ball of string’ gradually evolves, spreading out from the vertical axis as a vertical ellipse. The wider the stereo image, the more circular this tangle of string becomes, with a perfect circle being the full‑width stereo ideal.
Going beyond this, as out‑of‑phase components start to dominate, the ‘ball of string’ starts to flatten out into a horizontal ellipse (indicating reduced mono compatibility), eventually becoming a flat horizontal line when the two channels have completely opposite polarities.
Learning to interpret a goniometer and to relate the display to the way things sound takes time and practice, but it’s a skill well‑worth developing as it presents so much helpful information. For example, a good goniometer display makes it very easy to balance the gains on stereo mics or channels (the ellipse needs to be vertical and not leaning to one side), confirm precise source panning positions, establish a mic array’s correct SRA value, and even identify different types of stereo microphone array from the characteristic shape and holes within the ball of string!
When using a digital goniometer, it’s also possible to detect asymmetrical signals and distinguish them from true DC offsets, as well as recognising headroom and peak‑limiting issues.
To help build some experience of interpreting Goniometer readings, the demo tracks I recorded for this series might be helpful. For example, track 1 (the distant figure‑8 recording) gives quite a round graphic on the vectorscope, and the phase meter hovers close to zero — both indicating a wide stereo image extending across the full image width. In comparison, the hypercardioid version (track 2) is noticeably narrower on the ’scope (a vertical ellipse) and the phase meter sits around +0.3, whereas the cardioid version (track 3) is very narrow indeed (a tall thin ellipse) and the phase meter reads around +0.7.
You can get a good feel for the vectorscope display if you play with the stereo width when decoding an M‑S array (track 7). Monitor the decoded stereo output from an M‑S matrix, and start with the Sides signal muted, which will display as a vertical line showing the Mid signal on its own. As the Sides level is increased the ball of string will start to build and form an increasingly wider ellipse until full width is achieved with a round ball of string. Increasing the Sides level further will flatten the ball, indicating significant out‑of‑phase components... which you should also hear! It would also be worthwhile comparing the look of the display with coincident and spaced‑omni recordings, and with panned multi‑mic commercial pop recordings.
For my own recording and mastering work, I always have a goniometer in my line of sight (most also incorporate a phase correlation meter, by the way) and typically use it alongside a BBC twin‑twin PPM. In my own studio I rely on an (obsolete) DK Technology MDS600M++ stereo vectorscope, but on location I use a TC Electronic Clarity M digital meter (or plug‑ins if I’m working with a computer rather than a hardware recorder). On location, where auditioning is usually via headphones, the vectorscope meter is an essential tool for confirming stereo imaging information.
Subjective Differences: Audio Examples
In the main text, I said that spaced‑omni microphones portray stereo positioning in a radically different way from coincident mics, and that most listeners perceive spaced‑omni recordings as creating a much less precise sense of image positioning. To relate the differences to another artform, if the coincident format is likened to a fine‑art oil painting, the spaced‑omni approach is perhaps more reminiscent of an impressionist watercolour — while a bit blurry and unfocused, the information is there, and sometimes that sound character is precisely what is desired. Personally, I think the spaced‑omni approach suits orchestral music in particular, as it gives an homogenous, spacious and luxurious kind of sound; it doesn’t generate lots of potentially distracting detail.
A second benefit associated with the A‑B technique is that omni mics usually have a much more extended low end than typical directional microphones, as well as negligible phase‑shift and a more natural and neutral sound character. Consequently, the spaced‑omni approach is often favoured in situations where those features are beneficial to the material being recorded, over and above the format’s stereo imaging characteristics.
As well as understanding the theoretical difference, it’s good to experience the differences in sound for yourself. So, if you get a chance, check out audio examples 7, 8, 11 and 12 in the media files associated with this series (on the SOS website: https://sosm.ag/this-is-stereo-media). These illustrate the stereo imaging characteristics of spaced‑omnidirectional microphones versus coincident arrays. I recorded two basic A‑B pairs in my ad hoc session with the Teme Valley South Churches Choir (TVSCC). Track 11 (OCCO Omnis) was captured with a pair of Sennheiser MKH 20 omni mics, spaced at 69cm to give an SRA of 96 degrees, at a medium distance from the choir. You can compare the stereo imaging with the (decoded) Mid‑Sides array (track 7), mounted in the same location and using the same family of microphones (MKH 30/40). When decoding the Mid‑Sides array, adjust the Side channel’s level to achieve a similar overall stereo width as the OCCO omnis — about +2dB if using the Voxengo plug‑in. Track 12 (Wide Omnis) uses the same Sennheiser MKH 20 omni microphones, but spaced much wider (83cm) for an SRA of 75 degrees. These mics were placed further from the choir, alongside the Neumann SM69 set up as coincident figure‑8s (track 1). Again, these two mic arrays have the same nominal SRA, so their imaging characteristics can be compared directly, albeit with a more distant perspective than the previous examples.
The BBC Twin‑Twin PPM
The BBC, since its inception, have always used the PPM as the standard level indicator, with its unique 1‑7 scale. When stereo was being introduced at the BBC in the 1960s, the corporation developed a unique dual‑concentric twin‑needle meter movement with a British manufacturer Ernest Turner (and later manufactured by Sifam).
These were mechanically identical and only differed in the colours of their two needles. The Type 74B has red (left) and green (right) needles to indicate the left and right channel levels against a black background with the standard white scale numbered from 1 to 7. The red/green colour allocation is the same as aircraft and ship navigation lights, and the red needle is always in front of the green.
The Type 74A has white and (originally) all‑yellow needles to show the sum (Mid) and difference (Sides) signals, respectively (white at the front). However, it was found that the yellow needle tended to fade over the years, becoming whiter, while the white needle tended to oxidise towards a yellow hue… which could become quite confusing! Consequently, around the 1980s the yellow needle was replaced with a black one which had a fluorescent orange tip to avoid any confusion! (The zplane PPMulator XL plug‑in retains the traditional all‑yellow ‘S’ needle).
 Diagram 3: zplane’s PPMulator, an emulation of the classic BBC PPM.
A typical BBC console installation employed a pair of these twin PPMs with a 74B on the left showing the left/right signals, and a 74A on the right showing the sum/difference signals, as shown in Diagram 3. When the BBC first started broadcasting in stereo, the content was mainly classical music, and it was found that the mono sum of a typical stereo recording was about 3dB louder than either the left or right channels because they were largely decorrelated. Consequently, it was decided that the circuitry driving the M‑S meter would attenuate the outputs to both needles by 3dB, such that the left/right and sum needles all showed roughly equivalent peak levels. This configuration later became known as M3.
However, commercial broadcasting worked mostly with centre‑panned speech and pop music mixed with all the louder instruments and vocals panned centrally. This kind of material has strong correlation between the two channels, resulting in the Mid signal being around 6dB higher than either channel individually. As a result, they decided to implement 6dB attenuation to the M and S meter signals — a configuration now known as M6 — giving roughly equal peak levels on the left, right and sum meters. This alignment also makes calibration with reference tones easier as all three needles sit exactly on PPM 4. The BBC converted its M‑S meters to the M6 configuration in the 1990s, and zlane’s PPMulator XL plug‑in (Diagram 3) can be configured for either M3 or M6 modes. I’d argue that the M3 option is better for classical or other wide stereo music material, while M6 is better for mono speech and popular music.
In use, the benefits of the twin‑twin PPM display are many. Firstly, it’s very easy on the eye, and the angles of the needles immediately convey the signal level without having to refer to the scale. Secondly, the relative level balance between channels is instantly apparent from the angle between the red and green needles (which remains consistent at all volumes). There’s 4dB between each pair of scale numbers on a BBC PPM, so an offset of one number (eg. one needle peaking to 4 and the other to 5) indicates a sound source with a 4dB offset, which would position it roughly a quarter of the way across the sound stage from the centre. An offset of two scale marks (8dB difference) indicates a sound source roughly halfway to the loudspeaker... and so on.
In a similar way, the angle between the M and S needles indicates the stereo width. A centre‑panned signal leaves the S needle on the bottom stop, but as the stereo width increases the gap between M and S narrows. When the M needle lies directly over the S needle the stereo signal has full width (or a mono source has been panned fully to one side). If the S needle rises above M then there are strong out‑of‑phase elements in the mix, potentially reducing mono compatibility (the equivalent of a reading between 0 and ‑1 on a standard phase correlation meter).
I still use a hardware twin‑twin PPM on my mastering console in the studio and rely on it all the time as I find it much more intuitive and easier on the eye than bar‑graph meters in the DAW. When recording with a laptop on location I regularly use the PPMulator XL plug‑in — such is the wealth and value of the information that can be gleaned in an instant from this marvellous vintage stereo metering system.